
Energy Is The Primary Currency of Life
Energy acquisition and expenditure underpin nearly every aspect of animal life. My research combines field technologies with biomechanical and bioenergetic modeling to understand how animals acquire, allocate, and expend energy, and how these energetic demands vary across individuals, species, and environments. Key topics of interest include:
Fine-Scale Energetics of Movement
Locomotion is a costly biological process, particularly for animals that travel vast distances in search of food, mates, or suitable habitats. Fine-scale movement data can reveal how animals generate propulsion and minimize the instantaneous energetic costs of locomotion. Linking these fine-scale mechanics to broader behavioral patterns provides a framework for understanding how individual movements contribute to whole-body energy expenditure.
Finding and Capturing Food
Energy acquisition is fundamental to survival, and animals have evolved diverse strategies to locate, capture, and process food. Examining the biomechanics of foraging reveals how animals physically accomplish these tasks and the costs associated with different prey-search and capture strategies. Quantifying both the costs of obtaining food and the energy gained from successful feeding provides a direct measure of the net profitability of different foraging strategies.

Figure from Gough et al. 2025 - Overview of a single foraging dive performed by a short-finned pilot whale tagged with a CATS biologging tag. Part (A) shows the depth (top), swimming speed (middle), and per-second energetic expenditure (bottom) for the full period of the dive. Blue segments along the depth trace represent acoustic click production, while orange circles denote the timing of foraging buzzes derived from acoustic data. Gray segments correspond with periods (>10 s) of active swimming; white corresponds with un-powered gliding. Black circles along the top denote the start times of individual tailbeats. Fine-scale energetic expenditure estimates from the thrust method (solid line) are shown in comparison to the simplified breathing frequency method (dotted line). Part (B) shows the acoustic record (top), jerk (middle), and swimming speed (bottom) for a zoomed-in segment of data around three foraging buzzes derived from acoustic data. Orange dotted lines denote the end positions of each buzz. Part (C) shows a further zoomed-in period of the acoustic record around one of the foraging buzzes (Buzz 2). Parts (D-F) show images from the CATS video record before, during, and immediately after the dive. The images in (E) correspond to Buzz 2, showing the ocean floor and what appears to be a squid ink cloud appearing <2 s from the end time of the buzz.
Building Baseline Energetic Budgets
Energy budgets provide a foundation for understanding how animals allocate resources among critical life functions (e.g., maintenance, movement, growth, reproduction). Quantifying the energetic costs of different behaviors can reveal how these demands accumulate over time and vary across individuals, life stages, and ecological contexts. Establishing these baseline requirements provides a framework for evaluating how environmental change or disturbance may alter the costs of living and allow us to assess the capacity of individuals and populations to absorb these additional costs and remain resilient.
Body Size Scaling and Morphology
Body size and morphology fundamentally shape how animals interact with their environment. Comparing biomechanical performance and energetic demands across body sizes and species can reveal broader patterns in ecological specialization and adaptation. These relationships provide a foundation for understanding how differences in body form influence the ecological strategies available to animals.
Current Ongoing Projects
CATS tag image from bubble-netting whale in southeastern Alaska. The tag is deployed on the dorsum and oriented forward, with the left pectoral flipper raised and a stream of bubbles appearing out of the blowhole.
Kinematics and Energetics of Bubble-Net Feeding In Southeast Alaskan Humpbacks
Bubble-netting is a highly specialized foraging behavior employed by humpback whales (Megaptera novaeangliae) in multiple locations around the globe. All forms of bubble-netting involve the use of a bubble curtain to corral or startle prey into a dense aggregation for easier consumption at higher densities, thereby increasing the energetic economy of the foraging bout. Different populations of animals have developed these strategies independently over time and use their bubble curtain in different ways. Some groups forage solitarily or in pairs and create a series of successively smaller curtains before lunging, while other groups range upwards in size from ~4-16 individuals, with designated “bubble-blowers” that form the bubble curtain. Many of these bubble-netting variations have been studied individually, but our study will be the first to directly compare the kinematics and energetic economy of different bubble-netting styles using a combination of UAV drone and biologging tag data for animals from three distinct populations.
Representative annual cycle for a mysticete whale (Humpback: Megaptera Novaeangliae). The top left depicts the variables affecting daily foraging variability. The bottom left depicts a migration between a foraging ground (Western Antarctic Peninsula) and a breeding ground (Ecuador). The right side depicts the annual cycle of energy loss and energy gain.
Migration Energetics of large Whales
Long-distance migrations are one of the most energetically challenging behaviors observed within the animal kingdom. Animals migrate to track the seasonality of food sources or move between spatially distinct foraging and breeding habitats. Large body sizes, such as those seen in baleen whales (Mysticeti), are one adaptation allowing for migrations across vast distances. As capital breeders, mysticetes must also rely on the energy from a defined feeding season to last them throughout the year. Consequently, maximum migratory distance should be a function of energy gained during the feeding season. Using empirically-derived estimates of foraging and swimming energetic intake and costs for mysticetes of varying body sizes, we calculated the energy gained during a foraging season as well as the energy subsequently used during migration. For a successful foraging season, the energetic cost of migration only amounts to ~20% of foraging season energy intake across body sizes, while a poor foraging year could result in exorbitant migratory costs of ~100% or more. We also found that migratory costs are dependent on total distance, duration, and swimming speed. Combining a theoretical model with satellite tracks of individual whales, we determined that longer migrations are more costly and occur at higher speeds than shorter migrations. In a rapidly changing ocean, small differences in the distance, duration, and/or speed of a migration could have major impacts on individual fitness.
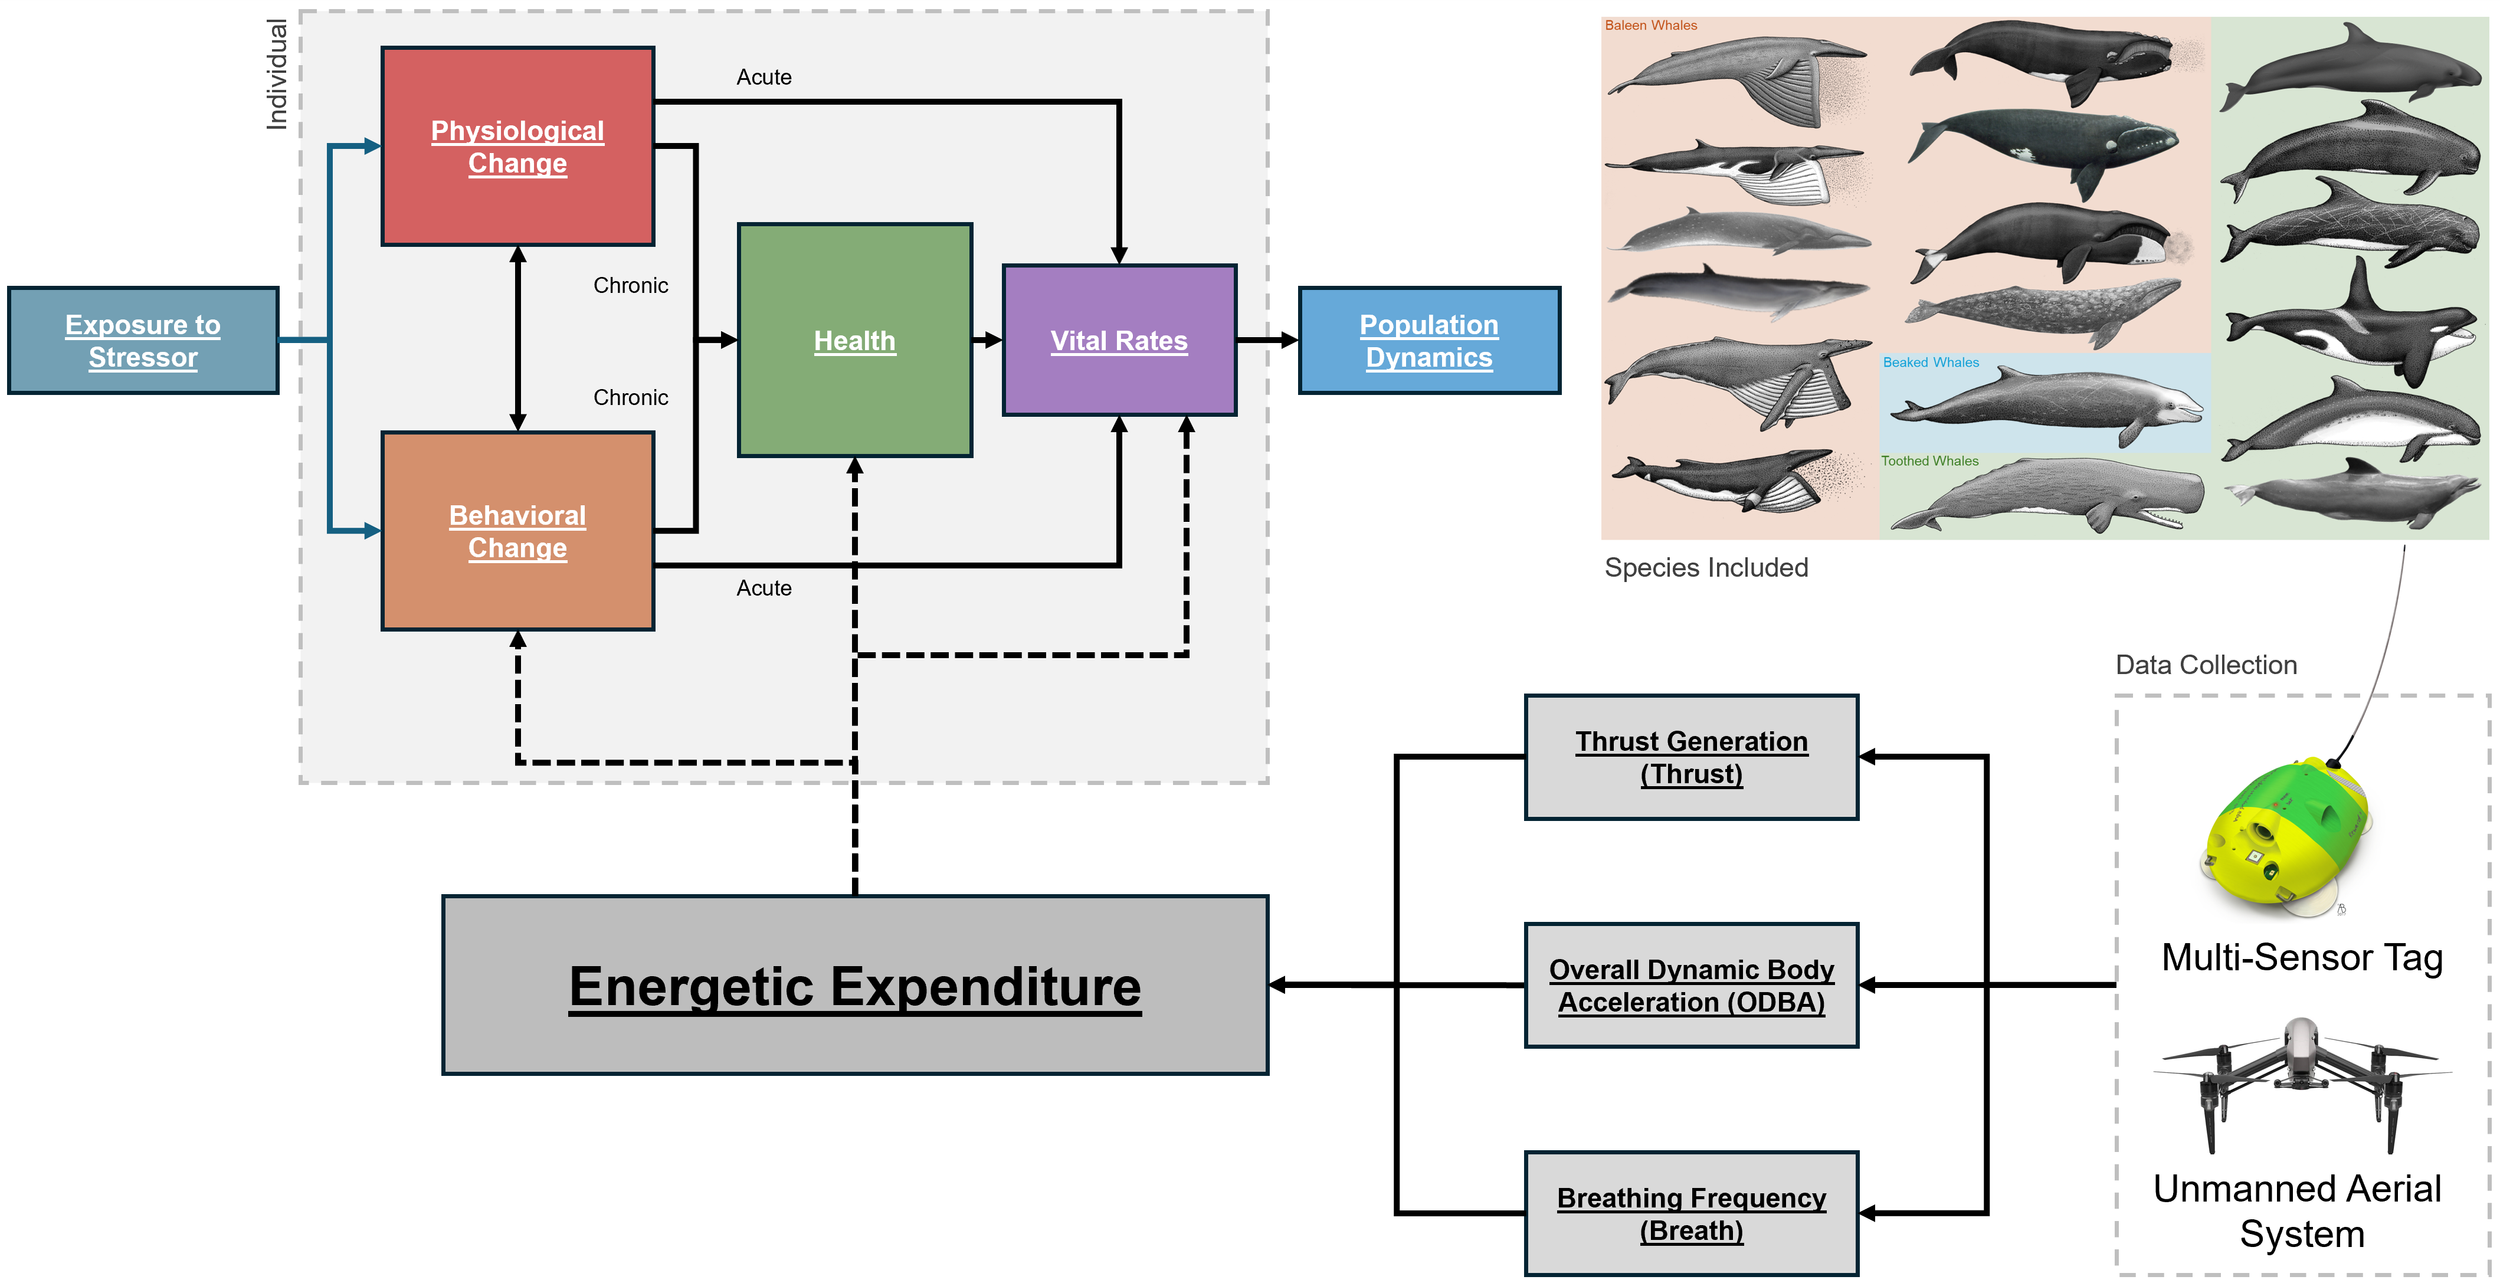
Population Consequences of Disturbance (PCOD) model (modified from Pirotta et al. 2018). Estimates of energetic expenditure are expected to inform the “Behavioral Change”, “Health”, and “Vital Rates” portions of the PCOD model. Data collection avenues (Multi-Sensor Tag and Unmanned Aerial System) and methods of calculating energetic expenditure (Thrust Generation, Overall Dynamic Body Acceleration, Breathing Frequency) are outlined. Illustrations show the 18 species to be included in methods comparisons - pink are baleen whales, blue is a beaked whale, and green are other toothed whales.
Energetic Expenditure of Cetaceans Across Scale
Energy use underpins every aspect of cetacean ecology, from foraging and migration to reproduction and survival. In this project, we are synthesizing large, existing datasets to better understand how energetic expenditure varies across whale and dolphin species and how it is best quantified in free-ranging animals. We are integrating on-animal biologging and drone-based photogrammetry data from hundreds of tag deployments spanning 18 cetacean species, representing a broad range of body sizes, life histories, and ecological settings. By comparing multiple approaches used to estimate energetic expenditure, we evaluate how methodological choices influence energetic estimates and how those estimates scale across species and behaviors. This work provides foundational energetic benchmarks needed to link short-term behavioral responses to long-term population outcomes. The results directly support Population Consequences of Disturbance (PCOD) frameworks and improve our ability to assess how environmental change and human activities influence marine mammal health, resilience, and population dynamics.